About Circle Graphs (Or "Pie Charts")
| using_percentage_to_draw_a_circle_graph.pdf |
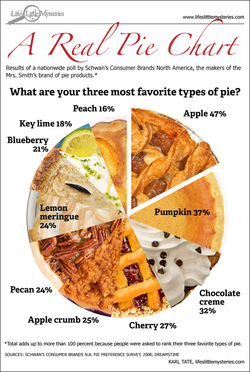
Circle Graphs, or Pie Charts, are used to show relative percentages of a whole.
To draw a circle graph, figure out the percentage of each data section in order to determine how many degrees each section will be in the circle.
Tutorial with GIFS:
http://www.wikihow.com/Make-a-Pie-Chart
To draw a circle graph, figure out the percentage of each data section in order to determine how many degrees each section will be in the circle.
Tutorial with GIFS:
http://www.wikihow.com/Make-a-Pie-Chart
