LESSON 8: CHOROPLETH MAPS
Learning Goal: We are learning how to analyze choropleth maps.
DEFINITION:
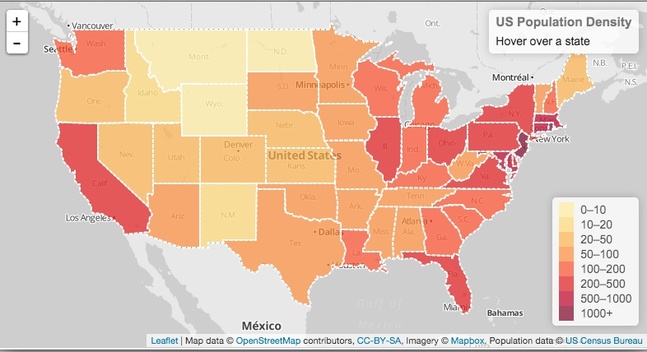
A choropleth map is a map that uses colours/patterns to give specific information about demographics (population and people). A common example would be a map of a country with different colours showing different population densities.
CHOROPLETH MAPS CAN SHOW:
BENEFITS:
Choropleth maps provide a graphic representation of the data that is quickly and easily interpreted.
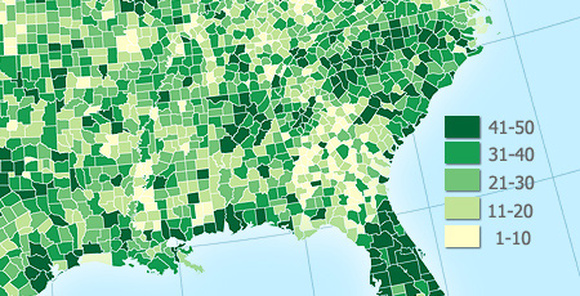
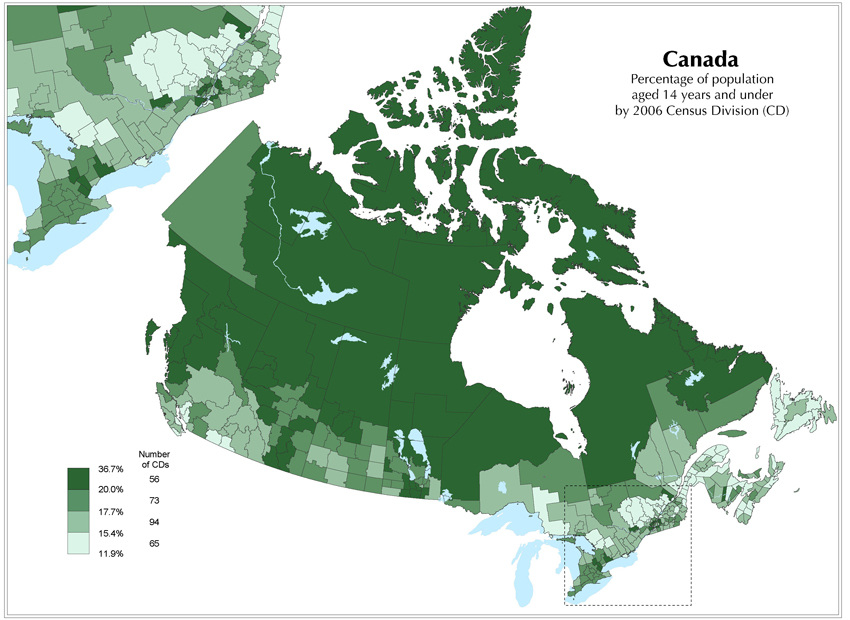
EXAMPLES:
A choropleth map is a map that uses colours/patterns to give specific information about demographics (population and people). A common example would be a map of a country with different colours showing different population densities.
CHOROPLETH MAPS CAN SHOW:
- Population density
- Average incomes
- Average age
- Voting preferences
BENEFITS:
Choropleth maps provide a graphic representation of the data that is quickly and easily interpreted.
EXAMPLES:
Activity: Making Your Own Map
|
http://www.teachingideas.co.uk/geography/worksheets/chlormapws.htm
| ||
